Imagine dragging a sandpaper sheet through water and then trying the same with a perfectly smooth tile. The difference in resistance is startling. Ships experience a similar effect. What looks like a small rough patch—or even invisible micro-roughness—on a hull can snowball into massive losses at sea. This is where Surface Roughness becomes one of the most underestimated yet costly enemies of fuel efficiency.
For ship owners, operators, and managers, fuel isn’t just an expense—it’s the lifeblood of operations. Fuel accounts for up to 60–70% of total voyage costs, and any inefficiency hits the bottom line hard. Surface Roughness quietly adds drag, forcing engines to work harder, guzzling more fuel, and increasing emissions.
In this long-form guide, we’ll explore what surface roughness is, how it develops, the heavy fuel penalties it causes, and what proactive measures you can take to reduce its impact.
What Is Surface Roughness in Shipping?
Surface roughness refers to the texture, irregularities, and microscopic unevenness of a ship’s hull surface. Even coatings and paints, when applied unevenly or degraded over time, can increase hull roughness.
In maritime terms, Surface Roughness is measured in microns (µm). A difference of just 50–100 µm can significantly change drag and fuel performance.
- A freshly coated hull is smooth, optimizing flow.
- Over time, fouling, abrasion, corrosion, and repeated paint layers add roughness.
- This roughness obstructs water flow, increasing turbulence and energy demand.
It’s like trying to ride a bicycle on a newly paved road versus a gravel path—the same effort produces vastly different speeds.
Causes of Surface Roughness
Several factors contribute to rising Surface Roughness:
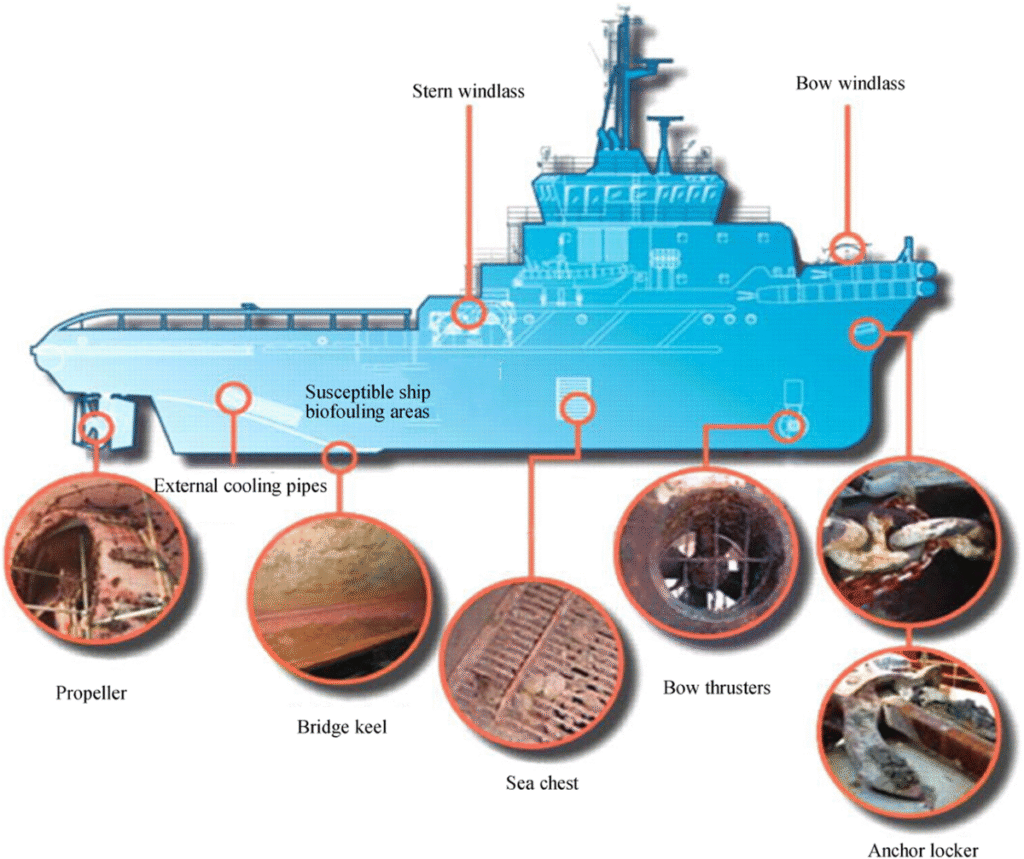
- Fouling Accumulation: Slime, algae, and barnacles create friction patches that increase drag.
- Coating Deterioration: Aging, cracking, or peeling of hull coatings exposes rough metal surfaces.
- Corrosion: Rust and surface pitting add layers of unevenness.
- Over-Painting: Repeated coats during dry dockings can cause an uneven hull profile.
- Mechanical Damage: Impacts, scrapes, and wear contribute to rough patches.
The rougher the surface, the larger the fuel penalty.
⚓ Get Your Ship Cargo Ready with Marine Super Cargo 🚢
— Marine Super Cargo (@Marinsupercargo) September 12, 2025
Your next voyage begins with a vessel that’s clean, compliant, and cargo-ready. At Marine Super Cargo, we deliver top-quality marine services: pic.twitter.com/3627aoKAZo
How Surface Roughness Impacts Fuel Consumption
The penalty is direct and unforgiving:
- A roughness of 100 µm can increase fuel consumption by 1–2%.
- Roughness over 200–300 µm may lead to penalties up to 10–15%.
- In extreme cases with fouling, penalties can exceed 30–40%.
These increases translate into significantly higher operational costs and emissions. For example:
- A large container ship burning 150 tons of fuel per day might consume an extra 15 tons daily from roughness and fouling combined.
- At $600 per ton, that’s $9,000 per day—a staggering annual figure in the millions.
The Environmental Penalty
The cost isn’t just financial. Fuel penalties from Surface Roughness go hand-in-hand with environmental damage.
- Higher fuel use means higher CO₂ and NOx emissions, directly affecting compliance with IMO MARPOL Annex VI.
- Increased emissions make it harder to meet IMO 2030 carbon-intensity targets.
- Biofouling risk rises, tied to invasive species transfer, a major concern highlighted by IAPH and regional port authorities like those in Australia and New Zealand.
So, the roughness story doubles as a compliance story. Regulatory landscapes are tightening, and surface smoothness directly links to global sustainability goals. Read more
Fuel Penalties: The Hidden Financial Black Hole
How bad can it get? Here’s a breakdown of fuel penalties linked to hull surface roughness:
- Minor Surface Roughness (50–100 µm): 1–2% fuel penalty.
- Moderate Roughness (100–200 µm): 3–5% penalty.
- High Roughness (200–300 µm): 8–12% penalty.
- Severe Roughness (300+ µm with fouling): 20–40% penalties in extreme cases.
This means operators can burn thousands of extra tons of fuel annually just from overlooked hull roughness.
Case Example: A Bulk Carrier’s Losses
A bulk carrier operating between Brazil and China was studied by Marine Insight. Within one year, its fuel penalty rose by 7% due to hull coating wear and partial fouling. Over the year, the vessel’s operator paid an excess of $1.8 million in fuel costs—entirely avoidable through timely hull cleaning and surface inspections. Also read
Methods to Measure Surface Roughness
Monitoring is critical. Industry practices to measure Surface Roughness include:
- Hull Roughness Gauges: Specialized tools that directly measure microns on hull panels.
- Laser and ROV Inspections: Offering high-precision, real-time underwater hull surveys.
- Data Analytics: Using engine load and performance data to infer increases in hull drag.
IMCA recommends integrating hull inspections into planned maintenance systems as a proactive measure.
Solutions to Reduce Surface Roughness
- High-Quality Coatings: Using coatings like Self-Polishing Coatings or Fouling Release Coatings keeps hull surfaces smoother for longer.
- Regular Hull Cleaning: Both in-water (diver/ROV cleaning) and during dry dock.
- Controlled Painting: Avoiding excessive paint layers during re-coating.
- Advanced Materials: Innovations in nanotechnology and silicone-based polymers.
- Hull Monitoring Programs: Predictive maintenance using digital tools backed by IMO and IAPH best practices.
Think of it like dental care for your fleet: better to maintain regularly than face costly surgery later.
Future Directions
The next wave of maritime innovation will push further:
- Nanostructured Coatings: Surfaces inspired by shark skin for ultra-low drag.
- AI-Based Hull Monitoring: Continuous predictive models tracking roughness via IoT sensors.
- Eco-Friendly Materials: Sustainable polymers replacing hazardous solutions.
- Hybrid Maintenance Models: Combining underwater robotic cleaning with eco-coatings.
With IMO’s decarbonization targets looming, the focus on efficiency-enhancing hull technologies will only intensify.
Practical Tips for Ship Operators
- Inspect hull surface roughness at every dry docking.
- Avoid unnecessary overcoating—smoothness trumps thickness.
- Use digital fuel monitoring to catch early signs of performance loss.
- Follow guidelines from IMCA and MARPOL for compliance alignment.
- Partner with service providers (like CleanShip.co) for in-water cleaning and eco-compliant maintenance.
Also read about Underwater Ship Hull Cleaning in Ecuador.
Conclusion
When it comes to efficiency, compliance, and sustainability, Surface Roughness is a silent but powerful factor.
Here are the three things to remember:
- Even small increases in roughness hit fuel consumption and profits hard.
- Rough hulls amplify environmental penalties, breaching compliance with IMO and MARPOL.
- Proactive inspections, coatings, and cleaning can safeguard long-term operational success.
To stay ahead, adopt modern hull management solutions today—start exploring your options with CleanShip.co.
FAQ:
Q1. How is Surface Roughness measured in shipping?
It’s measured in microns, typically using hull roughness gauges or underwater inspections. Even small increases lead to significant drag and fuel penalties.
Q2. What’s the main cause of ship hull roughness?
A mix of fouling, coating degradation, corrosion, mechanical damage, and over-painting all contribute to rising roughness over time.
Q3. How much extra fuel can roughness cause?
Small increases (100 µm) may add 1–2% penalties, while extreme cases with fouling can raise fuel use by 30–40%.
Q4. Are rough hulls a compliance risk?
Yes. Rough hulls increase emissions, making it difficult to comply with MARPOL Annex VI and IMO CO₂ reduction goals.
Q5. How can operators reduce surface roughness effects?
Regular hull cleaning, high-performance coatings, careful painting, and adopting hull monitoring systems all cut drag, fuel costs, and emissions.